


BANKING SECTOR PERFORMANCE
Unless otherwise noted, all data, graphs and tables have been produced to illustrate EU 28 data. The EU 28 data contained in this chapter has been compiled from publicly available information released by the European Central Bank unless otherwise noted. The data relevant for EFTA countries has been compiled from the corresponding national central bank, financial supervisory authority, national office of statistics and national banking associations members of the European Banking Federation.
Bank capital
European banks have continued building a solid capital position and strengthening their balance sheets throughout 2019. The recapitalisation effort that European banks have made following the 2008 financial crisis makes the European banking sector more resilient and robust. Capital, with the core equity Tier 1 ratio of EU banks on a fully loaded basis, which includes only capital of the highest quality, was at 14.3% in June 2019, same as the previous year and more than double the same ratio in December 2011.
After reducing the original total capital shortfall by more than €500 billion since 2011 and reaching zero in June 2017, mainly by raising new capital and retaining earnings, banks in the European Union have maintained the zero shortfall in 2019. Tier 1 and total capital also continue showing a positive trend, reaching 15.6% and 18.9% respectively in June 2019 up from 6.80% and 8.10% respectively in 2011.
In 2019, all banks met, once more, the liquidity coverage ratio above the minimum. Furthermore, the shortfall of all categories of capital in 2019 remained around the lowest levels.
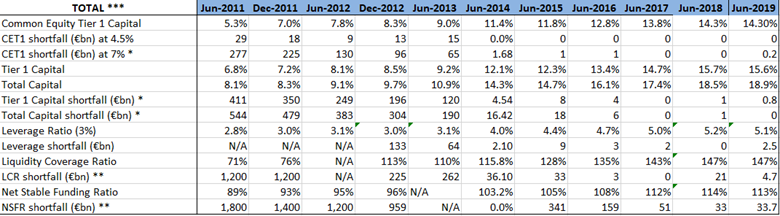
EBF calculations with data from EBA’s Basel III report monitoring exercise
*LCR figures from EBA report on liquidity measures **Including G-SIB surcharge ***Overall shortfall group 1 and group 2 **** Assumption of weights: 80% G1; 20% G2
Bank funding
The share of deposit liabilities over total assets remained in 2019 at 54.2%, in line with the positive trend started in 2007 (47.3%) that reveals the shift towards greater reliance on deposits as a source of funding.
The rise in the share of non-banks’ deposits to total assets slightly declined from 39% in 2018 to 38.8% in 2019.
The country breakdown for total deposits shows that domestic deposits were equivalent to less than half of the assets in Denmark, Ireland, Sweden, Finland, UK and Luxembourg. The figures continue to reflect, in part, different banking models, for example the well-developed covered bond markets in Scandinavia. Meanwhile, countries with the largest shares of deposits financing the banking sector’s assets were Lithuania, Bulgaria, Croatia, Slovenia, Slovakia, Estonia, Poland, Portugal, Latvia, Italy and Romania, all of which had deposits equivalent to 70% or more of assets.
The EFTA countries experienced a substantial increase in the share of deposit liabilities over total assets in 2019 reaching 60.9% up from 55.9% a year earlier, becoming the second highest level since 2009, only after the 69% reached in 2013.
Assets
The amount of total assets held by EU banks expanded in 2019 after a few years of consecutive contraction. This time enlarged by approximately €3 trillion from the previous year amounting to €49.3 trillion (€32.4 billion in the euro area and €13.1 billion in the non-euro area). The expansion came basically from gain in the total assets in the euro area countries (4.8%).
Considering the country breakdown, the country with the strongest boost in absolute terms were France and Denmark with €150 and €133 billion (13.6% and 12.7% respectively). Among the four largest European countries, only France registered a substantial positive result in their stock of assets, followed by Germany with 6.9%. Italy and Spain showed minimal increase around 1%. Only four countries experienced reductions in their stocks of assets: Malta (-6.8%), Cyprus (-6%), Latvia (-0.3%) and Portugal (-0.6%).
Bank profitability
With the ECB maintaining its ultra-low interest rates throughout 2019, profitability remained a key challenge facing European banks. The return on equity (ROE), a key indicator to assess the banking sector’s attractiveness for investors has been slowly recovering. The ROE of European banks was 5.4% in 2019 for EU 28, down from 6.1% in 2018. Despite the decline, due to a more moderate rise in several countries compared to 2018, this remains at similar levels as in previous years albeit still far from the 10.6% registered in the outset of the financial crisis.
Reflecting on the national breakdown, all countries have a positive ROE, for first time since 2007, with six countries having a double-digit ROE, led for the second consecutive year, by Hungary (16%), Romania (15.2%) and Czech Republic (12.5%). Only Greece (0.7%) registered a result lower than 1% in 2019. The difference between the highest (Hungary) and lowest (Greece) ROE was 15.3 percentage points in 2019, very far from the 101.6 recorded in 2013 (11.4% in Czech Republic and -90.2% in Slovenia).
The ROE across EU countries diverged after 2007, signaling growing fragmentation, particularly across the Euro area. After reaching a peak in 2013 (25.8), the dispersion around the average ROE has substantially decreased. After reaching 3.5 in 2018, the dispersion is at 4.0 in 2019, still less than the 4.5 seen in 2007 before deviation started.